How Much Water Does the World Use?
Global data set shows monthly water use by irrigation, manufacturing, and other uses, helping researchers to analyze water use by region and season.
The Science
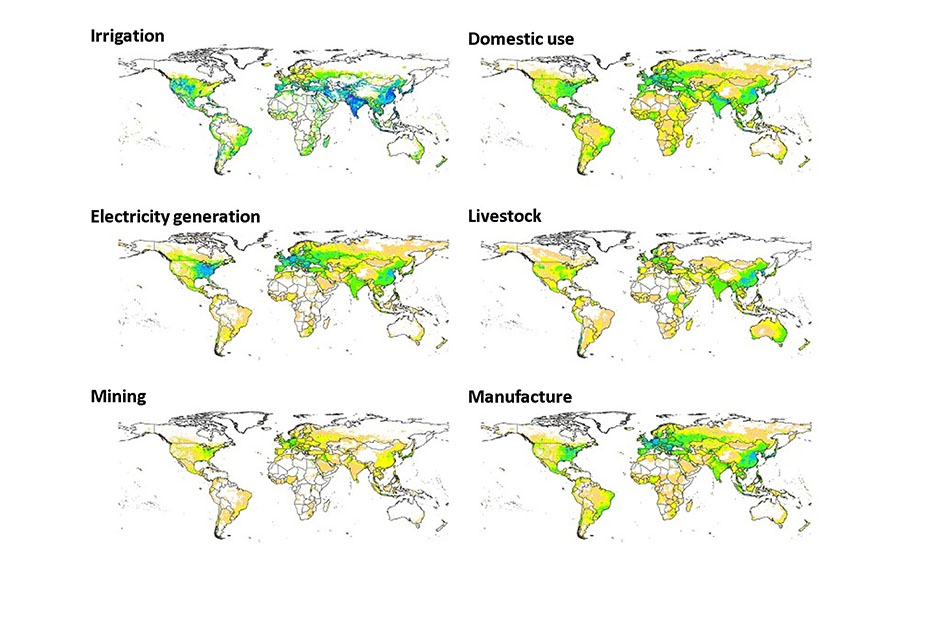
Human water use alters the global water cycle. How? Answering that question is difficult because the available data was by year and by country. Researchers need water use by small regions, not averaged across massive countries. They also need to see how water use varied by activity. A team reconstructed a global monthly water withdrawal data set for 1971 to 2010. It’s based on a grid that covers the world. It describes water use for irrigation, domestic purposes, electricity generation, livestock, mining, and manufacturing. The data set is the first reconstructed such data product at seasonal and regional resolution that’s derived from different models and data sources.
The Impact
The reconstructed gridded water withdrawal data set is open access. Scientists can use it to compare water withdrawal estimates from global hydrologic models. Also, they can use it to supplement water withdrawal estimates in Earth system models. In these two types of models, domestic and industrial water withdrawal representations are often lacking or inadequately represented. The data set is also important for investigating water-use related issues and patterns at fine spatial, temporal, and sectoral scales. Such investigations are critical for developing sound water management strategies.
Summary
Information on human water use is often available only on large space and time scales. To better inform Earth system models and global hydrologic models, an international team led by Pacific Northwest National Laboratory created estimates of water withdrawals on a smaller scale. They divided the Earth’s surface into areas 0.5 degrees by 0.5 degrees (about 50 kilometers [30 miles] square near the equator) and combined the larger-scale data on water use with records of population, temperature, power usage, agriculture, manufacturing, and mining. They used several models to estimate water use in each of the grid areas and verified their estimates with historical records between 1971 and 2010. The data set will be useful for water management and Earth system modeling and studies.
Contact
Biological and Environmental Research Program Manager
Bob Vallario
Multisector Dynamics
Bob.Vallario@science.doe.gov
Principal Investigator
Mohamad Hejazi
Pacific Northwest National Laboratory and Joint Global Change Research Institute
Mohamad.Hejazi@pnnl.gov
Funding
This research was supported by the Office of Biological and Environmental Research, Office of Science, Department of Energy through the Multisector Dynamics, Earth and Environmental System Modeling Program. Support from the National Natural Science Foundation of China is also acknowledged.
Publications
Z. Huang, M. Hejazi, X. Li, Q. Tang, C. Vernon, G. Leng, Y. Liu, P. Döll, S. Eisner, D. Gerten, N. Hanasaki, and Y. Wada, “Reconstruction of global gridded monthly sectoral water withdrawals for 1971–2010 and analysis of their spatiotemporal patterns.” Hydrology and Earth System Sciences 22, 2117 (2018). [DOI: 10.5194/hess-22-2117-2018]
Related Links
Pacific Northwest National Laboratory science highlight: Reconstruction of Global Gridded Monthly Sectoral Water Withdrawals for 1971-2010 and Analysis of Their Spatiotemporal Patterns
Highlight Categories
Performer: University , DOE Laboratory
Additional: Collaborations , International Collaboration