New Mariners and a Massy Map
 David Kirkby
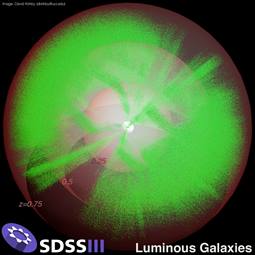
The Sloan Digital Sky Survey III surveyed 14,000 square degrees of the sky, more than a third of its total area, and delivered over a trillion pixels of imaging data. This image shows over a million luminous galaxies at redshifts indicating times when the universe was between seven and eleven billion years old, from which the sample in the current studies was selected.
Map-making can be a massy business. Not a messy one—though even Coleridge's Ancient Mariner may have spilled coffee on his parchments too—but rather a massy one, the art and science of showing the stuff that's there.
That's what researchers at the Office of Science's Berkeley Lab and their colleagues from the Sloan Digital Sky Survey (SDSS) recently created. Not the coffee spills, though there may have been a few of those along the way, but rather, the most accurate map of the stuff in the universe.
To make their massy map, the team used the largest 3-D color map of the universe ever made, the composite of Sloan Digital Sky Surveys I, II and III, which took in more than 1 trillion pixels of imaging data showing over a third of the total area of the sky (14,000 square degrees) including 1.5 million galaxies.
From that data, the Berkeley-led team selected some 900,000 galaxies, largely ancient red galaxies which are visible at great distances due to their exceptional brightness. Researchers then measured their brightness in five different colors, which gave them precise measurements of their distances to Earth, and their relationships to one another in space.
Then it was time for some serious number crunching. The researchers took the information to Berkeley Lab's National Energy Research Scientific Computing Center which broke the data down, and built it up into the most accurate calculation yet made of everything in space and how it sticks together. Their massy map showed not only what we see clearly, bright stars and great galaxy clusters; but also the stuff we can't see, the dark matter that helps hold everything together and the ghostly neutrinos that flit through space at the speed of light.
What's more, by showing where everything is—and isn't—the map also traced the evolution of the universe. It allowed researchers to in a sense run the movie backwards, to show how stars and galaxies came together across space and throughout time. And by supplementing their data with information from other data sets, the Berkeley Lab researchers were able to make extremely accurate calculations of the fundamental forces, the constraints that have been woven into the fabric of the cosmos from its first moments until today.
What's emerged is one of the most accurate pictures of the universe to date, a map of the Mariner's "wide, wide sea." Ancient sailors sometimes steered their ships to new discoveries by following the stars. In a sense, researchers supported by the Office of Science are still following their lead, discovering the mysteries of the universe by charting the marks of galaxies on their massy map.
For more information about Berkeley Lab, please go to: http://www.lbl.gov/. And for more about DOE's Office of Science, please go to: http://science.energy.gov/.
Charles Rousseaux is a Senior Writer in the Office of Science.